Is your team tacking without a map?
A mockery of KPIs and a lesson from the Bay of Puck.
6 min read

Picture a captain who tells the crew at the start of a voyage, “We’re sailing to Island X!”, shoves the nautical chart into his pocket, and only comes back a year later to check if they made it.
In business, we call this an “annual performance review” and pretend everything is fine. At sea, that strategy ends in disaster. Here’s how combining a cycling watch, sailing, and business kept me from hitting the rocks.
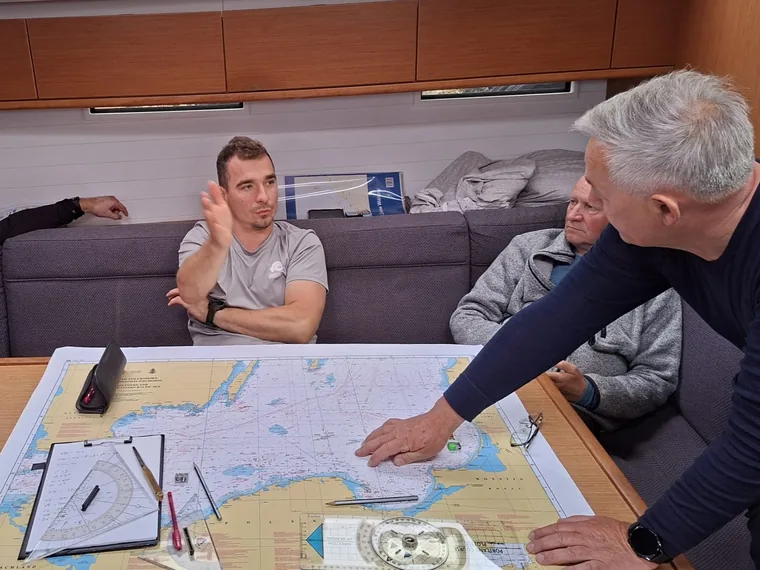
Before my first training sail on the Baltic Sea, I’d never really thought about what a nautical chart looks like. As it turns out, the Baltic quickly teaches you that a two-dimensional map requires three-dimensional thinking—especially around the Bay of Puck, where the depth can suddenly drop below a single meter. It might seem like plotting a course at sea is just drawing a straight line between two ports. Nothing could be further from the truth.
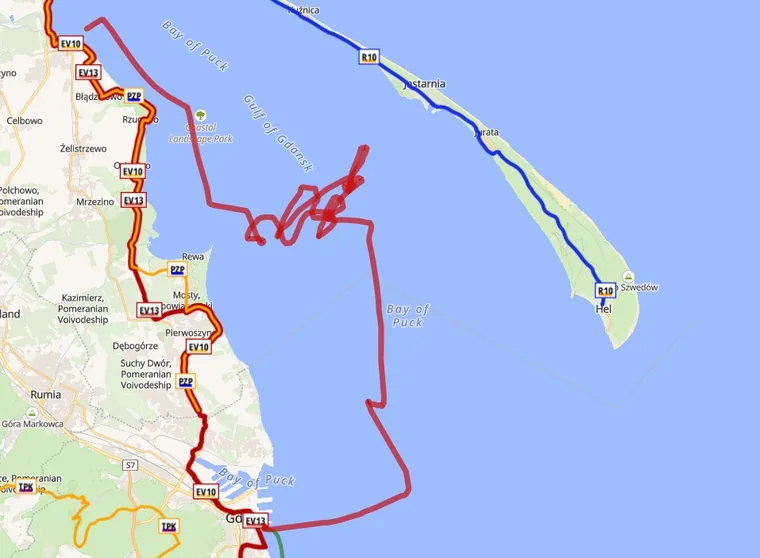
During a stretch of bad weather, I was lucky enough to take part in a practical navigation and chart-reading course. That’s when I thought to bridge two worlds: cycling and sailing. Using my smartwatch, I recorded GPS tracks (exactly as I do it on a gravel bike) from our sails and overlaid them directly onto the captain’s original route plan. A pretty neat feature!
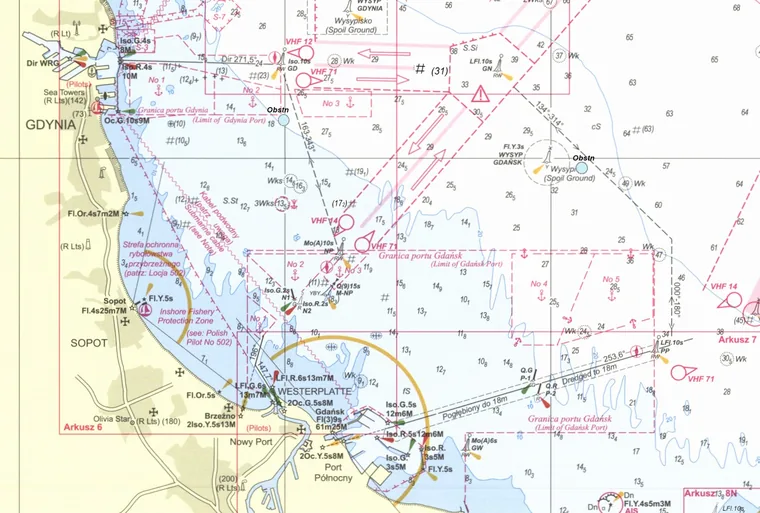
And that got me thinking: map, plan, wind, and weather assumptions vs. actual execution layered right on top. After all, isn’t that the very essence of management?
At the start of the year or quarter, we outline the goals we want to hit and set the famous KPIs. Then months go by—filled with putting out fires, solving daily problems, and grinding away—and only at the very end do we check whether we actually made it.
Can you imagine doing that at sea? Waiting until the end of the voyage to check where you ended up? Most expeditions like that would end in catastrophe.
Navigation is simply a transparent system that tells you exactly where you are at any given moment. Sure, today we have GPS and interactive charts, but navigation worked hundreds of years ago, too—the tools were just harder to learn and less accessible. Which only proves one thing: in today’s world, the lack of transparent goal tracking in business is downright criminal. It has never been easier. Making decisions when you have a clear picture in front of you is infinitely simpler and keeps risk to a minimum.
If you set a goal without providing the tools to track it, you’re just like that captain leaving his crew without a map. If your team is smart, they’ll probably figure something out—you can always look around and rely on a basic wrist compass.
It’s just that before you finally reach port, your actual route might look a little like this:
How I see it
Take a goal focused on acquiring expertise or taking over a specialization — a topic I’ve been working on for the past few years.
Sometimes, a company hires one person who can handle a niche task that requires deep domain knowledge and experience — the kind of skill you won’t learn on LinkedIn Learning or from an internal training catalog. Even if you assign this “competence handover” using the SMART methodology:
Specific. The employee independently and flawlessly creates complete product specifications for new items.
Measurable. Prepares 5 complete specifications that pass approval without substantive revisions.
Achievable. Transitions from passive observation and support to full independence within 12 weeks.
Relevant. Relies on existing templates, mentor support, and a gradual increase in task difficulty.
Time-bound. Exactly 3 months from the start date.
There’s a high chance they’ll get stuck at step one because they won’t even know where to start. Or they’ll call the resident expert, share the idea, and hear — at best — “Okay, so how can I help you?”
First, you need to carve out dedicated time solely for this task; otherwise, fires and escalations will take over. So, the employee gets a protective umbrella to focus on tasks that are Important/Not Urgent (based on Eisenhower’s matrix). This is our first “map”: checking weekly if the scheduled time was actually spent on the project, and reacting immediately if it wasn’t. Important/Not Urgent tasks are easily pushed aside by Important/Urgent (or worse, Unimportant/Urgent) ones, and you simply can’t let that happen.
The second aspect is the step-by-step roadmap. You start with “you don’t know what you don’t know”, but you can set a rule that each step takes no more than one workday.
Breaking this task down into smaller, binary steps (where there’s zero doubt whether they’re finished) is crucial:
- Draw a schematic of the test bench after consulting the expert
- Prepare a list of components to buy for the test bench
- Order components
- Prepare a rough sketch of the bench for the designer
- Create a 3D model of the bench
- Prepare execution drawings
- 3D print the parts…
- Build the test bench
From a list like this, you can build a simple “progress bar”. With 12 weeks to hit the goal, it becomes easy to see if your timeline is slipping. Plus, a detailed list makes it effortless to delegate subtasks (purchasing, 3D design, etc.) to the right people, allowing your “soon-to-be local expert” to stay focused on what matters most.
Be ready for bumps in the road. In my experience, I’ve usually been able to announce a successful competence handover on time, but the path was never identical to day one’s plan.
To borrow a sailing analogy: when the wind shifts, you adjust your course. As long as you know where you are (tracking time spent, keeping priorities straight, and having a clear list of next steps) and make decisions with the end goal in mind, you’ll be just fine.
A plan structured like this can be reported in just two clear charts.
The first is the umbrella: sixteen hours a week set aside for the handover, and a note every Friday of what actually went in.
The umbrella: time set aside, time actually spent
192 h planned · 188 h logged · 4 h short
Cumulative
Per week
- Plan
- Logged
- At or ahead of plan
- Behind plan
The numbers
| Week | Plan | Logged | Plan Σ | Logged Σ | Δ |
|---|---|---|---|---|---|
| 1 | 16 | 22 | 16 | 22 | +6 |
| 2 | 16 | 13 | 32 | 35 | +3 |
| 3 | 16 | 17 | 48 | 52 | +4 |
| 4 | 16 | 15 | 64 | 67 | +3 |
| 5 | 16 | 16 | 80 | 83 | +3 |
| 6 | 16 | 20 | 96 | 103 | +7 |
| 7 | 16 | 9 | 112 | 112 | 0 |
| 8 | 16 | 6 | 128 | 118 | −10 |
| 9 | 16 | 0 | 144 | 118 | −26 |
| 10 | 16 | 23 | 160 | 141 | −19 |
| 11 | 16 | 17 | 176 | 158 | −18 |
| 12 | 16 | 30 | 192 | 188 | −4 |
| Total | 192 | 188 | −4 | ||
The second is the progress bar: twenty-four binary steps, two a week, none of them longer than a day.
The progress bar: binary steps, closed week by week
24 steps · 12 weeks planned · 14 weeks taken
- Plan
- At or ahead of plan
- Behind plan
The numbers
| Week | Plan | Done | Plan Σ | Done Σ | Δ |
|---|---|---|---|---|---|
| 1 | 2 | 2 | 2 | 2 | 0 |
| 2 | 2 | 4 | 4 | 6 | +2 |
| 3 | 2 | 1 | 6 | 7 | +1 |
| 4 | 2 | 2 | 8 | 9 | +1 |
| 5 | 2 | 0 | 10 | 9 | −1 |
| 6 | 2 | 2 | 12 | 11 | −1 |
| 7 | 2 | 1 | 14 | 12 | −2 |
| 8 | 2 | 2 | 16 | 14 | −2 |
| 9 | 2 | 2 | 18 | 16 | −2 |
| 10 | 2 | 2 | 20 | 18 | −2 |
| 11 | 2 | 2 | 22 | 20 | −2 |
| 12 | 2 | 2 | 24 | 22 | −2 |
| 13 | 0 | 1 | 24 | 23 | −1 |
| 14 | 0 | 1 | 24 | 24 | 0 |
| Total | 24 | 24 | 0 | ||
The effort came in on budget — 188 hours against 192, a rounding error. The scope did not: the last step closed in week fourteen, two weeks after the plan bar had filled up. Read once, at the end, neither number tells you anything. Read every Friday, the hours flag the trouble in weeks eight and nine, and the steps put a price on it. Same numbers; the only difference is when you looked at them.
Looking at the end result, it seems obvious — and that’s the point. The best solutions are the ones that look simple and obvious once you see them.